Interpret data naturally with two key tools
Digging through data to identify fraud, waste and abuse (FWA) can be a huge challenge. Fortunately, graphic analytics and machine learning can help.
With graph analytics, information is displayed in graph form so viewers can see the visual relationships and interactions between data points.
A machine learning system makes predictions based on past behavior or data and compares them against new data.
Combined, agencies can identify shifting relationships and patterns that can help steer the machine learning system in the right direction.
Read the article to learn how graph analytics and machine learning can help support your agency’s program integrity initiatives.
Related healthcare insights
Article
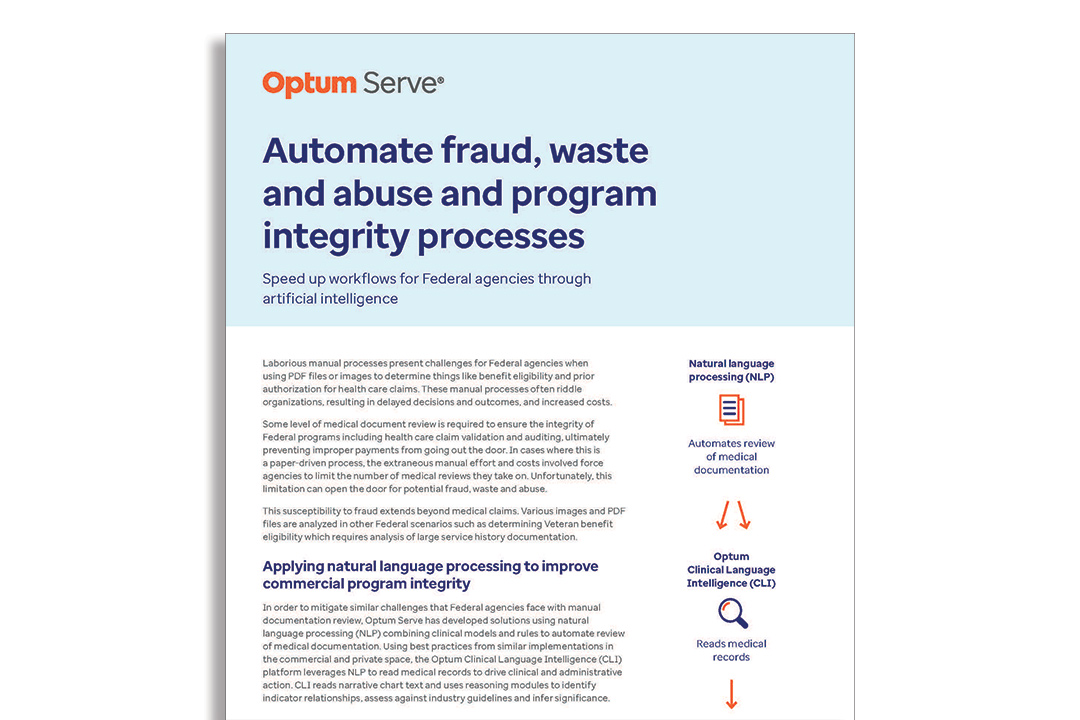
Learn how artificial intelligence (AI) and natural language processing (NLP) can help federal agencies improve program integrity, cut costs and deter fraud.
E-book
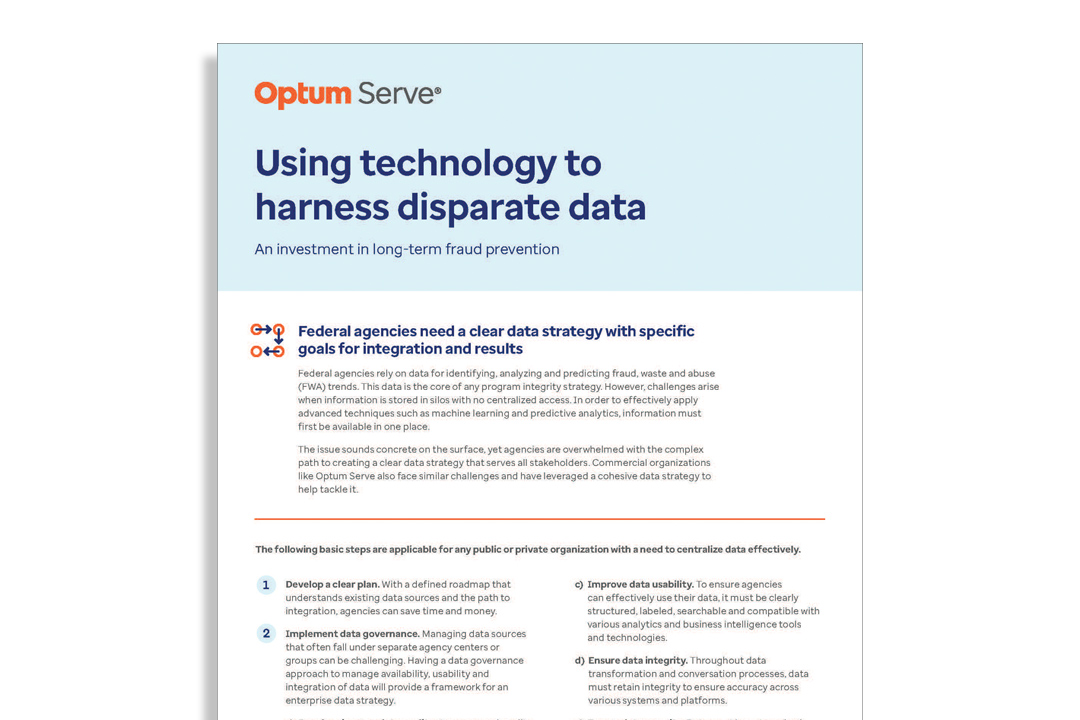
We partner with federal agencies to address challenges and support their unique needs through technologies, solutions and best practices.


